TIPS as an Inflation Predictor

September 6, 2026 by USTYC

What are TIPS?

Treasury Inflation-Protected Securities (TIPS) are a type of US debt instrument that includes an adjustment for inflation. When a TIPS reaches maturity, the holder is repaid the greater of the original principal, or an inflation-adjusted principal amount. The adjustment is based on the changes in Consumer Price Index (CPI) over the life of the bond, ensuring protection from inflation. TIPS are currently issued in 5, 10, and 30 year durations.

TIPS pay a coupon at a fixed rate, but the principal on which the rate is based will adjust over time. For example, a $1,000 TIPS yielding 1% will initially yield a $10 annual coupon. If the principal is adjusted upward 3% to account for the change in the CPI, then the principal is revalued at $1,030. The next annual coupon will be: $1,030 * 0.01 = $10.30.

This example is simplified for explanation. Actual TIPS pay semi-annual coupons, and their principal value is adjusted daily by the Treasury Department using a formula that smooths out the change over the last two reported months of CPI. You can calculate the principal adjustment using the Index Ratio published by the Treasury daily for each outstanding TIPS issue. There is a 3-month delay in adjustments because the BLS reports CPI for the previous month, and then the TIPS adjustment factors in the last two months of data.

Nominal, “risk free” and “real” interest rates

The nominal yields offered by US Treasuries are also commonly referred to as the “risk free” rate, the baseline rate of return at which an investor can avoid a risk of default (failure to pay the coupon or principal repayment). i.e. an investor is guaranteed the promised return. Unlike a corporation or municipality, it is unfathomable that United States government would end up in a situation where it can’t pay the coupons or principal on Treasuries because the US dollar is a fiat currency. The Federal government can always issue more debt or expand the money supply to raise the dollars necessary to meet current payment obligations. However, such activity may contribute to inflation.

The relationship between nominal rates and inflation

The yield on Treasury bonds, notes, and T-bills are nominal rates, meaning they do not have a built-in adjustment for inflation. An investor in a Treasury bond still faces a risk that their purchasing power will have been eroded by inflation by the time the bond’s principal is repaid. Most of the time, however, Treasuries still provide a return that exceeds the inflation rate.

On the secondary market Treasuries may trade above or below par value, which can influenced by the bond market’s expectation for inflation. If inflation expectations are high, bonds typically trade at lower values, which increases the nominal yield. The increase in the nominal yield is a premium to compensate for future inflation risk.

For example, if inflation is expected to average 3% over the life of a Treasury note and the note trades at 5%, then 3% of the nominal yield could be considered a premium to compensate for inflation risk, referred to as the “breakeven rate”. The remaining 2% (5% nominal yield - 3% inflation premium) is called the real interest rate, which reflects the actual return an investor would receive after considering the erosion of purchasing power caused by inflation. Because TIPS have a built-in mechanism to adjust for inflation, this practically removes the inflation risk premium part of their yield, making the TIPS yield considered to be the “real” interest rate.

The Fisher equation, and the breakeven rate

Fixed income investors are significantly impacted by inflation, which they must take into consideration when evaluating a fair purchase price for a bond. Therefore the bond market has an incentive to factor in future expectations of inflation, which gets reflected in pricing. The Fisher equation can be used to quantify this relationship in the context of a nominal interest rate, a comparable real interest rate, and inflation expectations:

Fisher Equation:
i = r + E(π)

i = the nominal interest rate  
r = the real (inflation adjusted) interest rate
E(π) = the market's projection of inflation over the duration of the bond

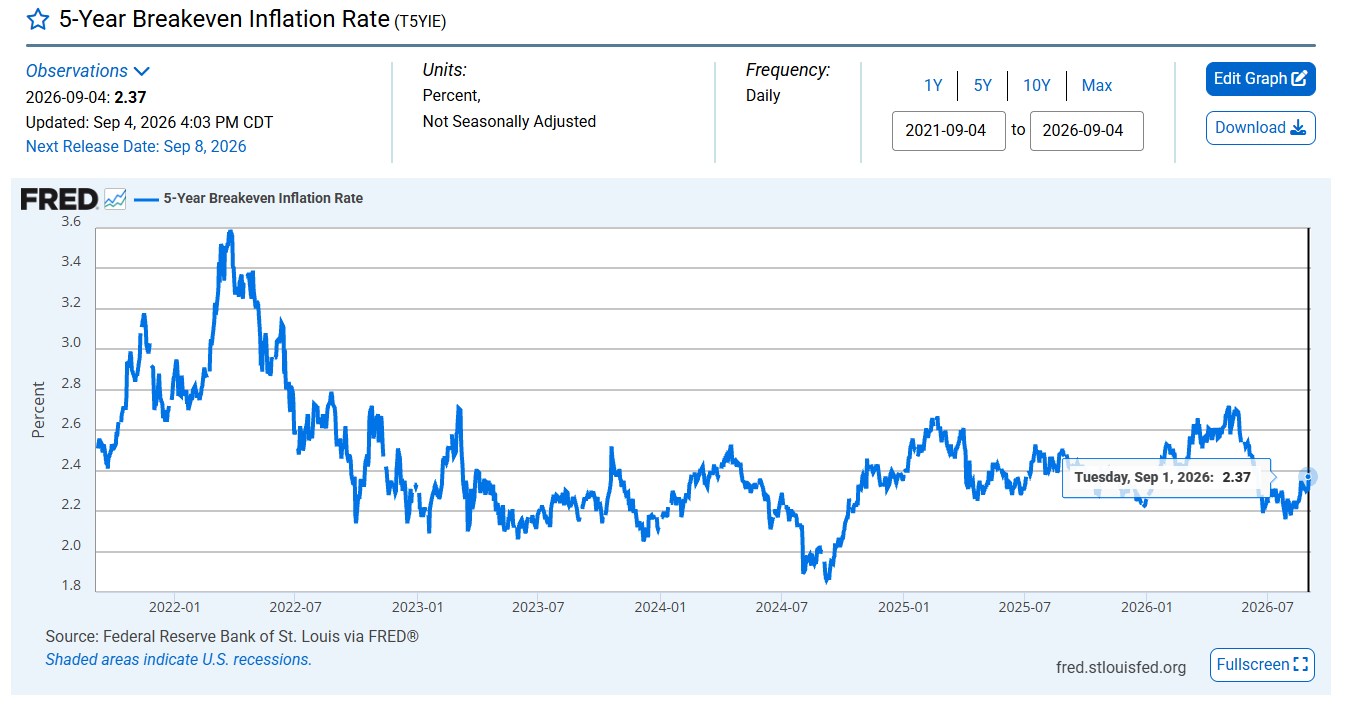
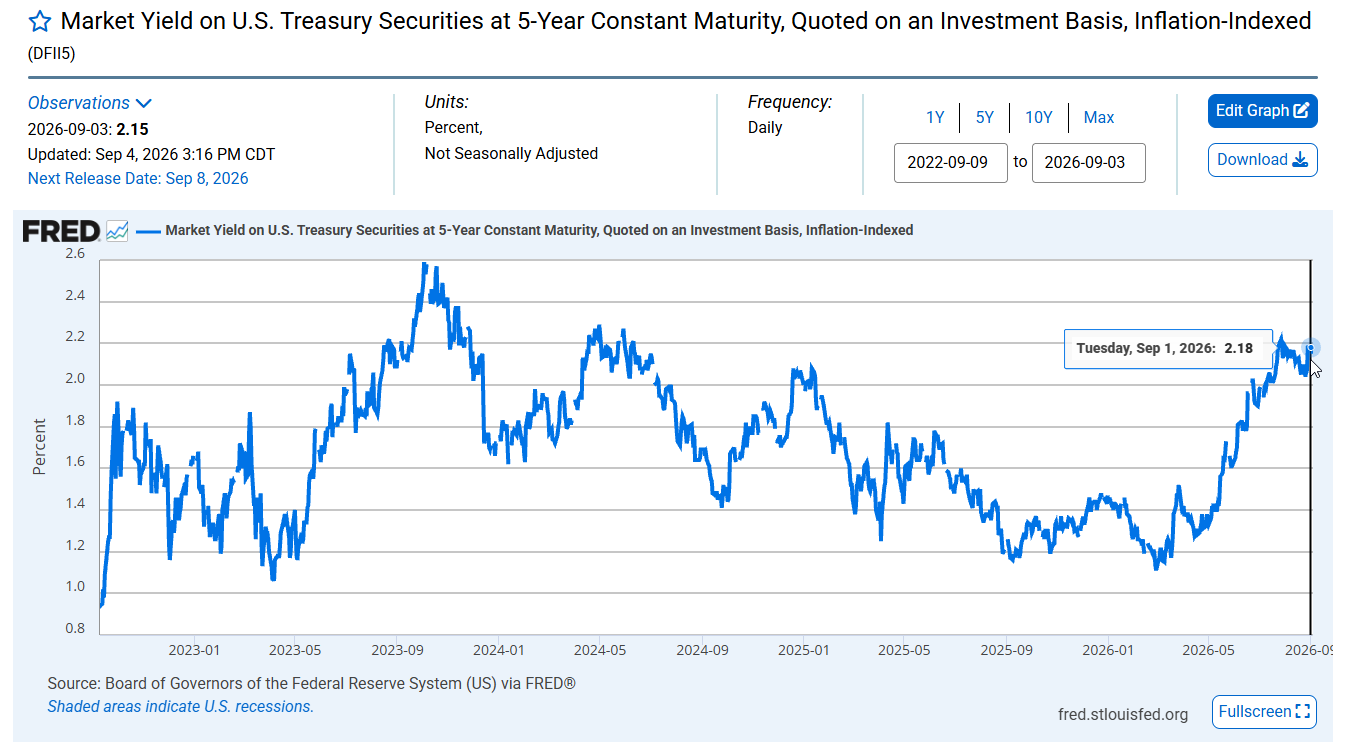
The Federal Reserve Bank of St. Louis refers to the market’s implied expectation of inflation as the “breakeven inflation rate”. FRED has datasets for all three values. Let’s look at these charts of the 5-year horizon.
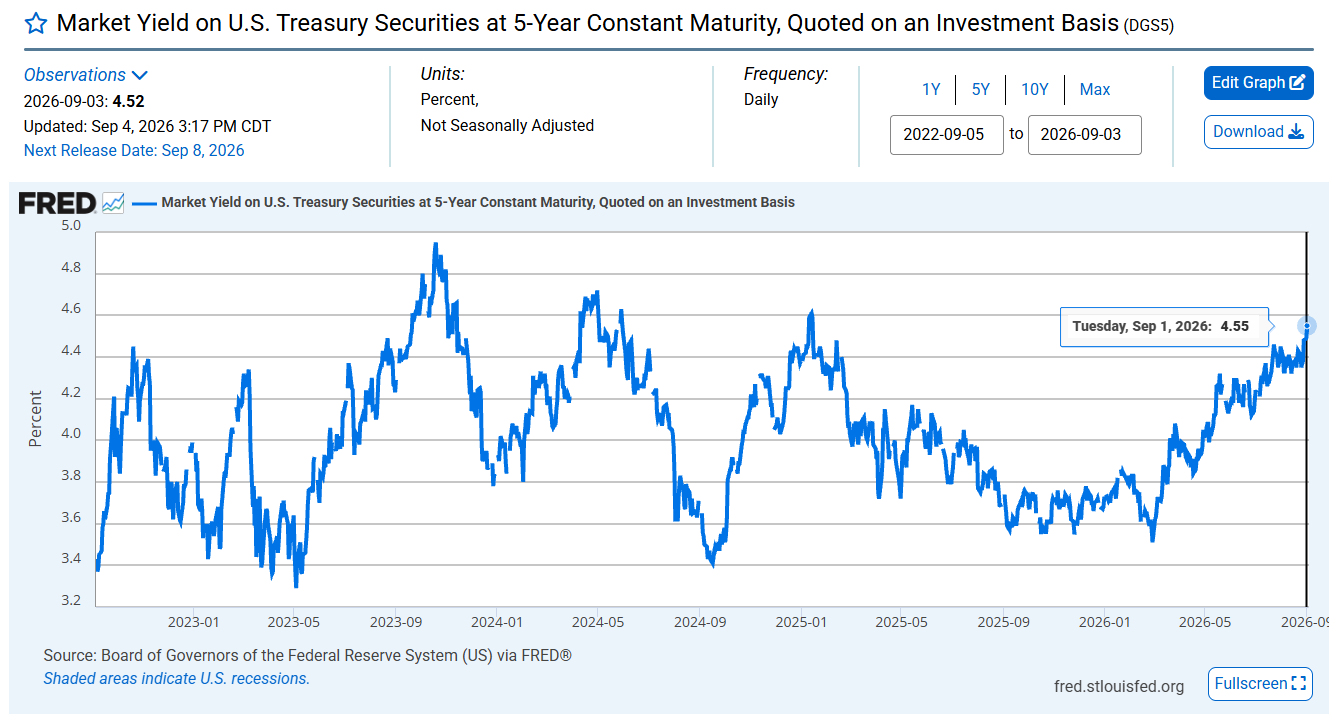
5-year nominal rate as of 9/1/26, as reported on FRED
5-year TIPS as of 9/1/26, as reported on FRED
This breakeven rate reported by FRED can also be calculated with the TIPS yield curve structure presented as the ustreasuryyieldcurve.com feature described below

Although the breakeven rate can provide a reasonable proxy for the market’s anticipated inflation rate, the value also bakes in some some liquidity premium because TIPS are less liquid than nominal Treasuries.

TIPS feature on the US Treasury Yield Curve Chart

Beginning in September 2026, the US Treasury Yield Curve app has a “TIPS” toggle, which will enable you to see a TIPS yield curve and compare it against the nominal Treasuries interest rate curve. TIPS data for any given trading day typically becomes available 2 business days after.
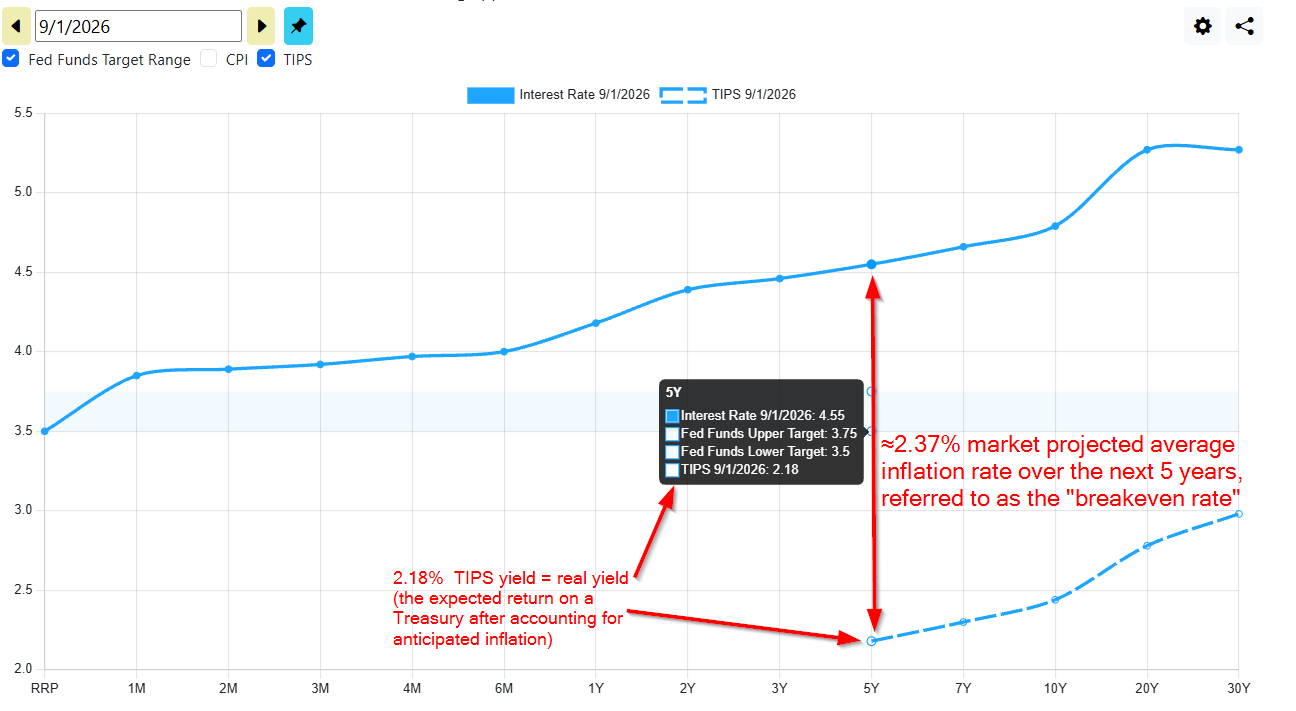
The new feature on ustreasuryyieldcurve.com allowing you to compare the nominal term structure vs the TIPS term structure.

References

Treasury Inflation-Protected Securities (TIPS) - Treasurydirect.gov
TIPS and Inflation: What to Know Now - Schwab
Inflation Expectations - Florida Atlantic University College of Business
How the Treasury Reports Its Debt Maturity Schedule

May 27, 2026 by USTYC

The United States is currently in debt by over $39 trillion. When will this bill come due and why does it matter?

The United States owes money to its creditors in the form of US Treasuries - Bonds, Notes, and T-Bills. Much of this debt will have its principal due to be repaid and its balance rolled over into new securities in the near future. Other portions of this debt are due farther out, which we call long duration. When a long duration security such as a 30-year Treasury bond has been outstanding for a long time and the expiration date nears, it will trade more like a T-Bill, and colloquially may be referred to as such. T-Bill, Note, and Bond are simply classifications based on remaining time to maturity.

Security Type Term Length Specific Maturities
Treasury Bills (T-Bills)[1] Short-term 4, 8, 13, 17, 26, or 52 weeks
Treasury Notes (T-Notes)[2] Medium-term 2, 3, 5, 7, or 10 years
Treasury Bonds (T-Bonds)[3] Long-term 20 or 30 years
Floating Rate Notes (FRNs)[4] Medium-term 2 years

You can find the breakdown of when all current US debt is due in a publication called the Monthly Statement of the Public Debt (MSPD). Published on the fourth business day of each month, it details the U.S. government’s outstanding debt obligations as of the end of the prior month, including due dates, the statutory debt limit, and where Treasuries are held — using categories such as “debt held by the public” and “intragovernmental holdings.”

The duration of outstanding Treasuries matters. If a trillion dollars in short-term T-bills is set to mature in the near future, the Treasury must issue new debt to repay that principal. If that refinancing is done using long-term bonds, which may carry a significantly higher interest rate, it can increase the government’s overall interest burden. When deciding the duration mix of new securities to roll expiring debt into, the Treasury department must consider market conditions versus the government’s need to pay a stable, manageable interest rate over the long term.

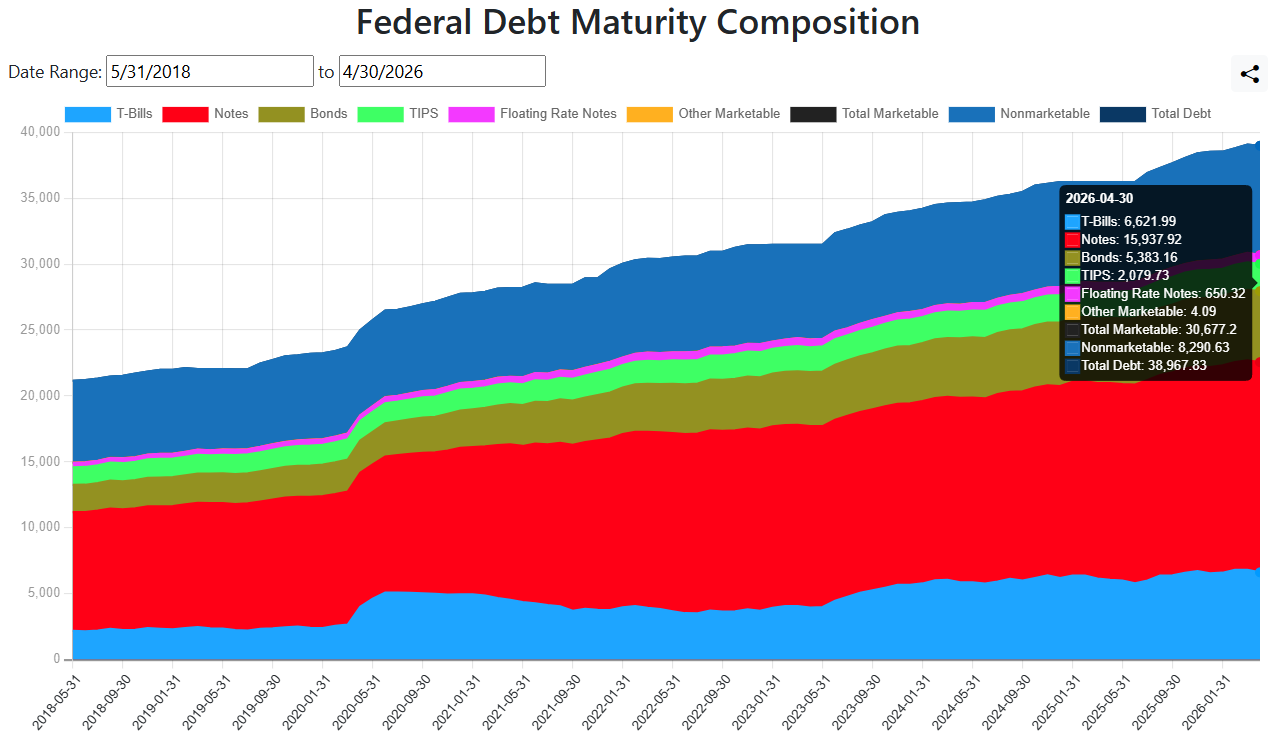
On this website’s Federal Debt Maturity Composition page, you can find a visual representation of the MSPD report. This chart breaks down the total US debt by the categories provided by the US government, allowing you to easily compare the size of each grouping of debt and how they have changed over time. In addition to the familiar categories of T-Bills, Notes, and Bonds, some of the reported categories are more ambiguous on the time frame they are due. Treasury Inflation-Protected Securities (TIPS) can be issued in durations of 5, 10, or 30 years, and are aggregated into a single category. However, they comprise less than 6% of the total US debt. Roughly 21% of the debt is in nonmarketable securities - illiquid bonds which include the Series EE and I savings bonds held by individuals[5], State and Local Government Series Securities[6], and certain issues meant to be held in intra-governmental accounts[7].

The Debt Maturity Composition Chart Provided by ustreasuryyieldcurve.com

The debt aggregation charts on this website are based on information obtained from the FiscalData website managed by the US Treasury Department. There you can download the source data sets and the full PDF publication of the MSPD.

The MSPD also contains much more granular data, which can be used to make even more detailed breakdown charts. If this is of interest to you, please come on our Patreon and provide your feedback and feature requests!

  1. TreasuryDirect.gov - Treasury Bills
  2. TreasuryDirect.gov - Treasury Notes
  3. TreasuryDirect.gov - Treasury Bonds
  4. TreasuryDirect.gov - Floating Rate Notes (FRNs)
  5. Series EE and Series I US savings bonds held by individuals
  6. State and Local Government Series Securities
  7. https://www.federalreserve.gov/econresdata/notes/feds-notes/2015/federal-debt-in-the-financial-accounts-of-the-united-states-20151008.html

Personal Consumption Expenditures (PCE) Price Index now available on the Time Series Chart!


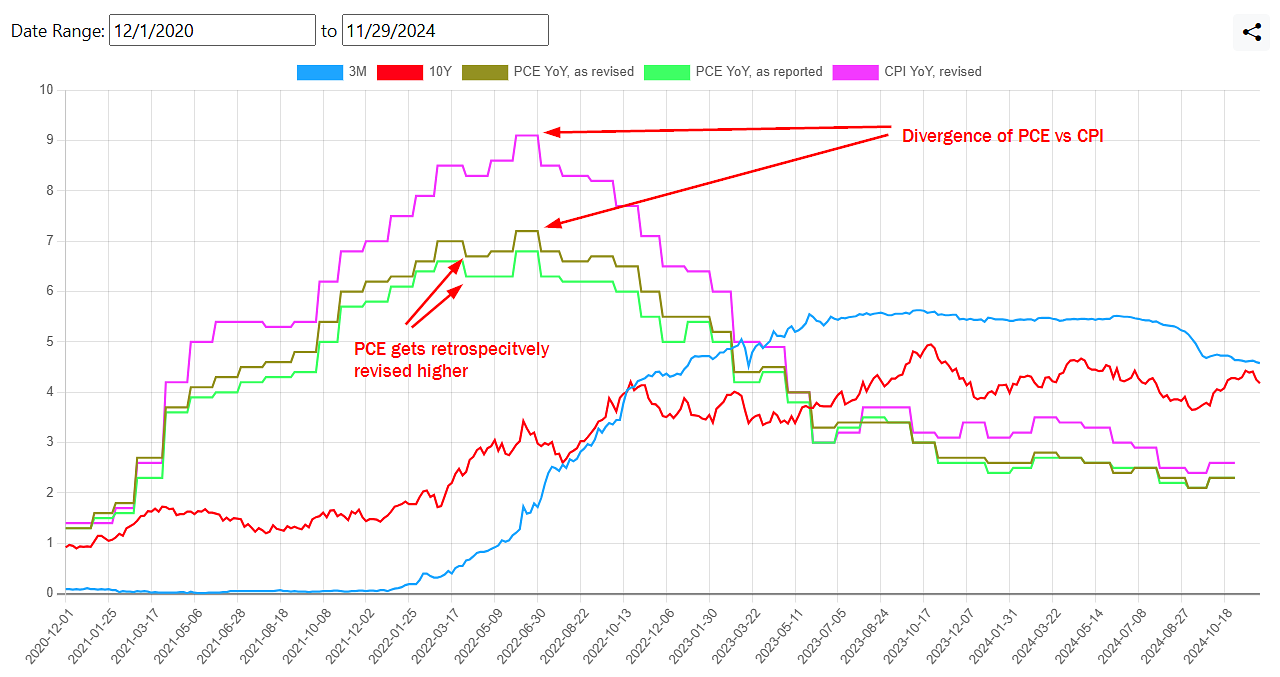
We just added the Personal Consumption Expenditures (PCE) Price Index to the Time Series Chart and Revisions page. PCE is a measure of inflation, similar to CPI, often referred to in media as the Fed's preferred measure of inflation. Like CPI, the PCE price index tracks the prices in a basket of goods over time. However, PCE is a chain-linked index, meaning that items in the basket can be substituted, unlike traditional CPI which keeps the same basket of goods and only adjusts the weighting of the categories. PCE has monthly adjustments to the basket whereas the CPI basket is only re-weighted annually. PCE is also frequently revised retroactively, whereas CPI is not. Because of these features, the Fed believes that the PCE Price Index provides a more comprehensive view of inflation than the traditional CPI.

The time series chart with the PCE inflation metric added


There are some areas where CPI's lack of backwards revision is desirable. For example, CPI is used for calculating pricing adjustments to Treasury Inflation-Protected Securities (TIPS). For social security's cost of living adjustment (COLA), CPI-W is used.

On this website, you can now compare CPI and the PCE index side by side on the same chart. We also have the Producer Price Index (PPI), which is thought to be a leading inflationary indicator. 

Here is an overview of the differences between the baskets:

+--------------------------------+------------------------+------------------------+---------------------+
|                                | CPI                    | PCE                    | PPI                 |  
+--------------------------------+------------------------+------------------------+---------------------+
| Issuing Authority              | Bureau of Labor and    | Bureau of Economic     | Bureau of Labor and |
|                                | Statistics (BLS)       | Analysis (BEA)         | Statistics (BEA)    |
+--------------------------------+------------------------+------------------------+---------------------+
| Purpose                        | Household/consumer     | Household/consumer     | Producer inputs     |
|                                | goods                  | goods                  | (leading indicator) |
+--------------------------------+------------------------+------------------------+---------------------+
| Chained?                       | No                     | Yes                    | Yes                 |
+--------------------------------+------------------------+------------------------+---------------------+
| Rebalance Frequency            | Annual                 | Monthly                | Annually            |
+--------------------------------+------------------------+------------------------+---------------------+
| Retroactive revisions?         | No*                    | Yes                    | Yes                 |
+--------------------------------+------------------------+------------------------+---------------------+

* CPI provides Seasonally Adjusted (SA) and Not-Seasonally Adjusted (NA) figures. The Seasonally Adjusted figures can be retroactively revised upto 5 years back, Not-Seasonally Adjusted figures are not typically revised unless there is a significant change in calculation such as the base year. The SA data set is intended for month-to-month measures of inflation, the NA data set is intended for year-over-year comparisons.      
Related references:


  • https://www.youtube.com/watch?v=oRdLvp6H3CU
  • https://www.clevelandfed.org/center-for-inflation-research/consumer-price-data
  • https://www.clevelandfed.org/publications/economic-trends/2014/et-20140417-pce-and-cpi-inflation-difference
  • https://www.morningstar.com/markets/whats-difference-between-cpi-pce