Personal Consumption Expenditures (PCE) Price Index now available on the Time Series Chart!
12/01/2024
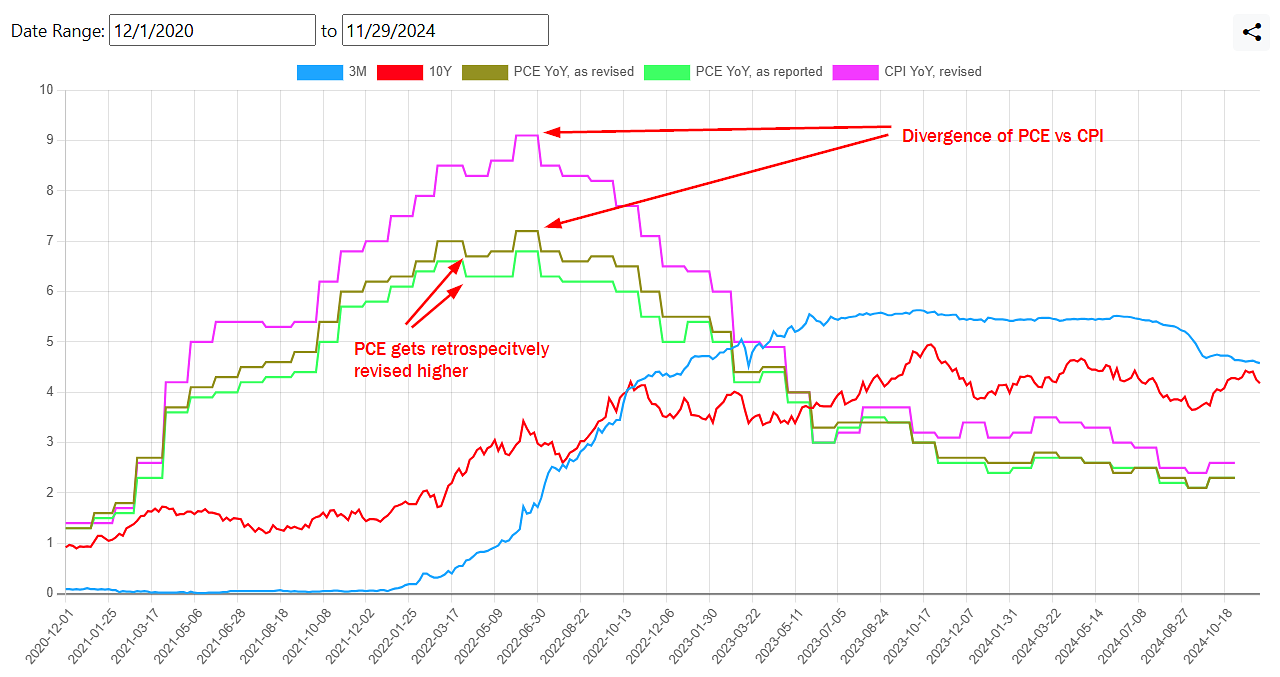
We just added the Personal Consumption Expenditures (PCE) Price Index to the Time Series Chart and Revisions page. PCE is a measure of inflation, similar to CPI, often referred to in media as the Fed's preferred measure of inflation. Like CPI, the PCE price index tracks the prices in a basket of goods over time. However, PCE is a chain-linked index, meaning that items in the basket can be substituted, unlike traditional CPI which keeps the same basket of goods and only adjusts the weighting of the categories. PCE has monthly adjustments to the basket whereas the CPI basket is only re-weighted annually. PCE is also frequently revised retroactively, whereas CPI is not. Because of these features, the Fed believes that the PCE Price Index provides a more comprehensive view of inflation than the traditional CPI.
There are some areas where CPI's lack of backwards revision is desirable. For example, CPI is used for calculating pricing adjustments to Treasury Inflation-Protected Securities (TIPS). For social security's cost of living adjustment (COLA), CPI-W is used.
On this website, you can now compare CPI and the PCE index side by side on the same chart. We also have the Producer Price Index (PPI), which is thought to be a leading inflationary indicator.
Here is an overview of the differences between the baskets:
+--------------------------------+------------------------+------------------------+---------------------+
|                                | CPI                    | PCE                    | PPI                 |
+--------------------------------+------------------------+------------------------+---------------------+
| Issuing Authority              | Bureau of Labor and    | Bureau of Economic     | Bureau of Labor and |
|                                | Statistics (BLS)       | Analysis (BEA)         | Statistics (BEA)    |
+--------------------------------+------------------------+------------------------+---------------------+
| Purpose                        | Household/consumer     | Household/consumer     | Producer inputs     |
|                                | goods                  | goods                  | (leading indicator) |
+--------------------------------+------------------------+------------------------+---------------------+
| Chained?                       | No                     | Yes                    | Yes                 |
+--------------------------------+------------------------+------------------------+---------------------+
| Rebalance Frequency            | Annual                 | Monthly                | Annually            |
+--------------------------------+------------------------+------------------------+---------------------+
| Retroactive revisions?         | No*                    | Yes                    | Yes                 |
+--------------------------------+------------------------+------------------------+---------------------+

* CPI provides Seasonally Adjusted (SA) and Not-Seasonally Adjusted (NA) figures. The Seasonally Adjusted figures can be retroactively revised upto 5 years back, Not-Seasonally Adjusted figures are not typically revised unless there is a significant change in calculation such as the base year. The SA data set is intended for month-to-month measures of inflation, the NA data set is intended for year-over-year comparisons.
Related references:
- https://www.youtube.com/watch?v=oRdLvp6H3CU
- https://www.clevelandfed.org/center-for-inflation-research/consumer-price-data
- https://www.clevelandfed.org/publications/economic-trends/2014/et-20140417-pce-and-cpi-inflation-difference
- https://www.morningstar.com/markets/whats-difference-between-cpi-pce