US Treasuries Yield Curve
A charting app for interest rates and macroeconomic indicators
Overview and Usage
This is a web application for exploring US Treasury interest rates. You can view past interest rate yield curves by using the arrows around the date slider or by changing the date displayed in the box. The checkboxes below the date slider toggle the display of additional information — the Fed Funds target range, or the most recent CPI reading.
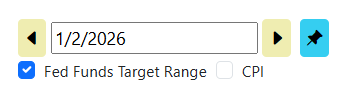
Use the pin button to stick a copy to the chart for comparison against other dates.
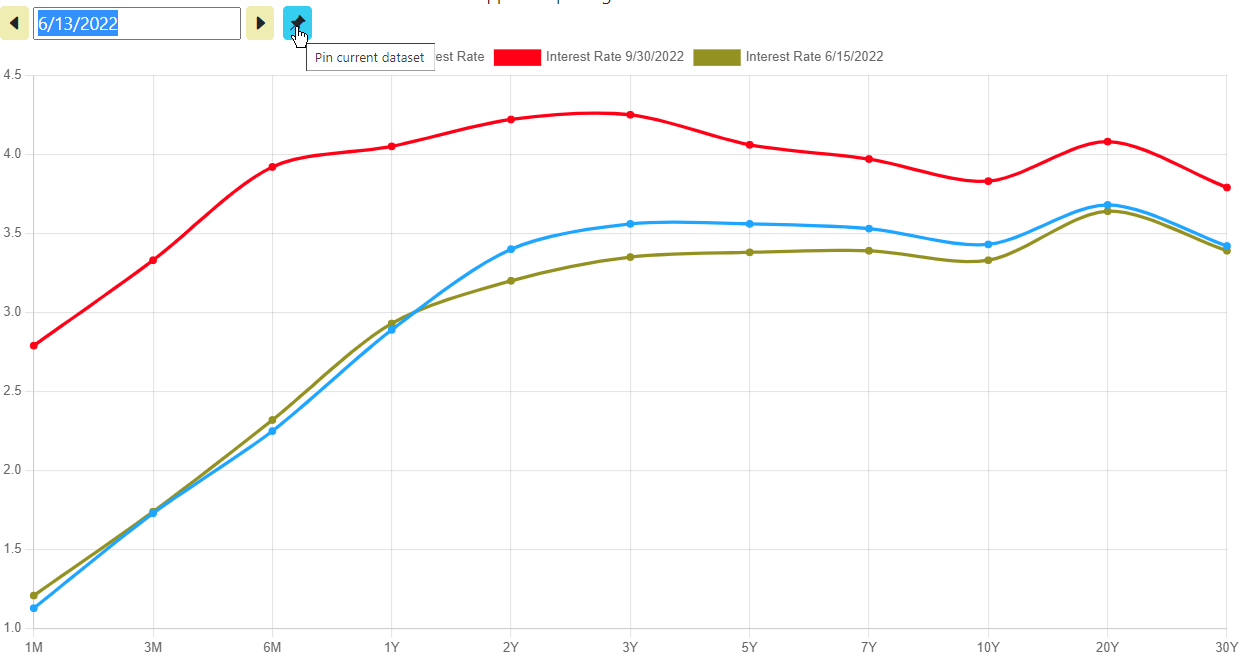
- Y-axis values represent the constant maturity interest rate for a given duration. X-axis values represent duration in months or years.
- "RRP" refers to the award rate of the Fed's Reverse Repo Facility.
- The dataset goes as far back as 1934. Information for some bond maturities may not be available for all time periods.
Share Link