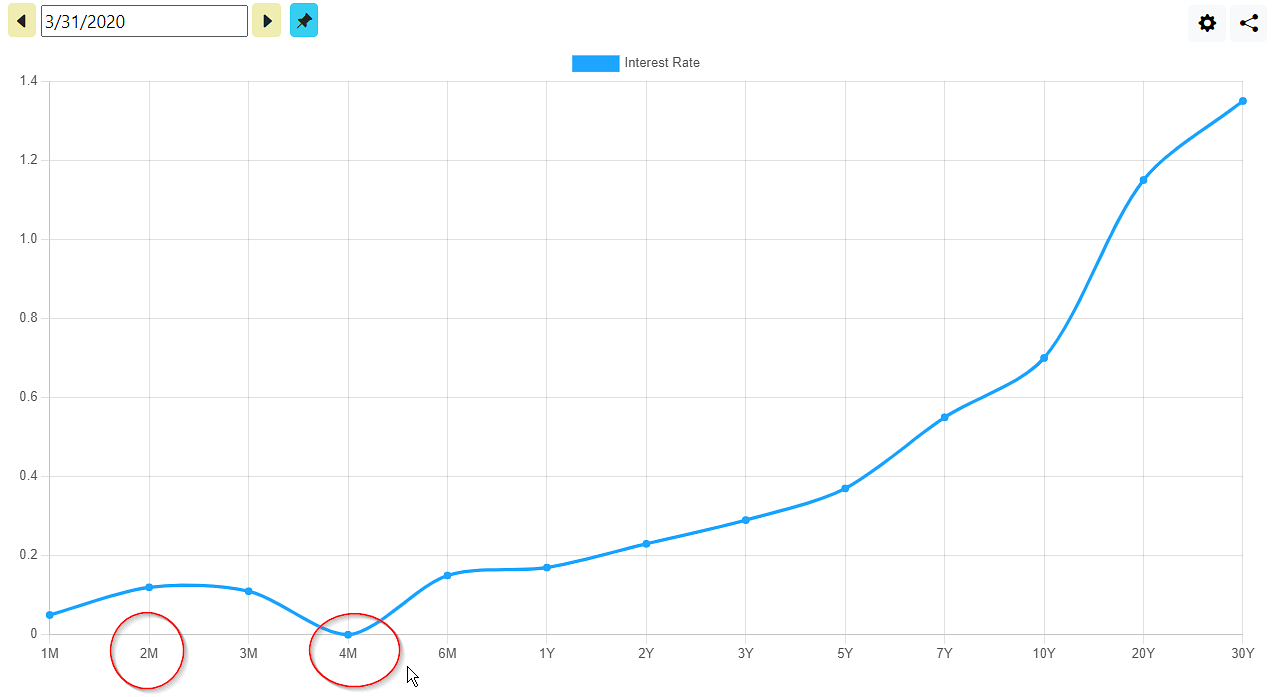
Now available! 2M and 4M T-Bills have been added to the yield curve chart. 2M (8 week) bills became available on 10/17/18 and the 4M (17 week) on 10/19/22.
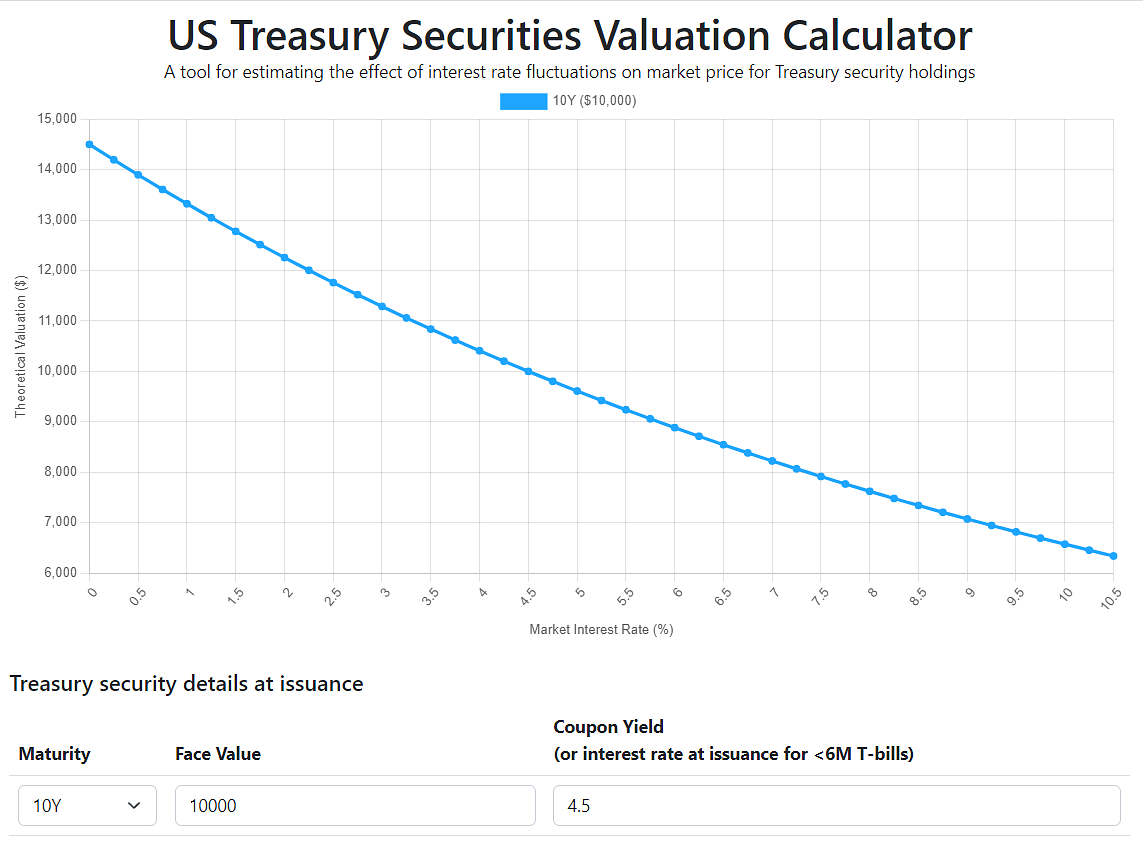
Also, check out our newly added "Valuation" feature which features a calculator that will alllow you to approximate the effect of a Treasury security's market pricing for a given change in interest rates. As you will be able to see by playing with this feature, a rising interest rate environment will not affect your coupon yield and face value but it will cause the mark-to-market value of your held security to go down. If only Silicon Valley Bank had a tool like this...
In an effort to make the website more useful, we are planning on adding two more data sets to the yield curve chart: The Fed's Overnight Reverse Repo Facility Rate (ON RRP) and the Fed Funds Rate. Both of these rates are critical in determining short term interest rates in the economy.
RRP, along with the IORB (Interest on Reserve Balances held at the Federal Reserve Banks) rates, is what the Fed's Open Market Trading Desk uses to set a floor on overnight lending prices in the banking system. A more detailed overview can be read here in this article by the New York Fed.
The Fed Funds Rate is actually a 25 basis point range that determines the Fed's interest rates on it's open market operations. we are thinking about maybe displaying this as a colored band that will stretch across the chart when viewing the yield curve.
Since it may not be desirable to view these rates in all circumstances, we also would like to add a settings feature to the chart which will allow the user to select which interest rate values are to be displayed on the chart.
We will keep you posted here on the progress of these upcoming features.