How the Treasury Reports Its Debt Maturity Schedule

May 27, 2026 by USTYC

The United States is currently in debt by over $39 trillion. When will this bill come due and why does it matter?

The United States owes money to its creditors in the form of US Treasuries - Bonds, Notes, and T-Bills. Much of this debt will have its principal due to be repaid and its balance rolled over into new securities in the near future. Other portions of this debt are due farther out, which we call long duration. When a long duration security such as a 30-year Treasury bond has been outstanding for a long time and the expiration date nears, it will trade more like a T-Bill, and colloquially may be referred to as such. T-Bill, Note, and Bond are simply classifications based on remaining time to maturity.

Security Type Term Length Specific Maturities
Treasury Bills (T-Bills)[1] Short-term 4, 8, 13, 17, 26, or 52 weeks
Treasury Notes (T-Notes)[2] Medium-term 2, 3, 5, 7, or 10 years
Treasury Bonds (T-Bonds)[3] Long-term 20 or 30 years
Floating Rate Notes (FRNs)[4] Medium-term 2 years

You can find the breakdown of when all current US debt is due in a publication called the Monthly Statement of the Public Debt (MSPD). Published on the fourth business day of each month, it details the U.S. government’s outstanding debt obligations as of the end of the prior month, including due dates, the statutory debt limit, and where Treasuries are held — using categories such as “debt held by the public” and “intragovernmental holdings.”

The duration of outstanding Treasuries matters. If a trillion dollars in short-term T-bills is set to mature in the near future, the Treasury must issue new debt to repay that principal. If that refinancing is done using long-term bonds, which may carry a significantly higher interest rate, it can increase the government’s overall interest burden. When deciding the duration mix of new securities to roll expiring debt into, the Treasury department must consider market conditions versus the government’s need to pay a stable, manageable interest rate over the long term.

On this website’s Federal Debt Maturity Composition page, you can find a visual representation of the MSPD report. This chart breaks down the total US debt by the categories provided by the US government, allowing you to easily compare the size of each grouping of debt and how they have changed over time. In addition to the familiar categories of T-Bills, Notes, and Bonds, some of the reported categories are more ambiguous on the time frame they are due. Treasury Inflation-Protected Securities (TIPS) can be issued in durations of 5, 10, or 30 years, and are aggregated into a single category. However, they comprise less than 6% of the total US debt. Roughly 21% of the debt is in nonmarketable securities - illiquid bonds which include the Series EE and I savings bonds held by individuals[5], State and Local Government Series Securities[6], and certain issues meant to be held in intra-governmental accounts[7].

The Debt Maturity Composition Chart Provided by ustreasuryyieldcurve.com

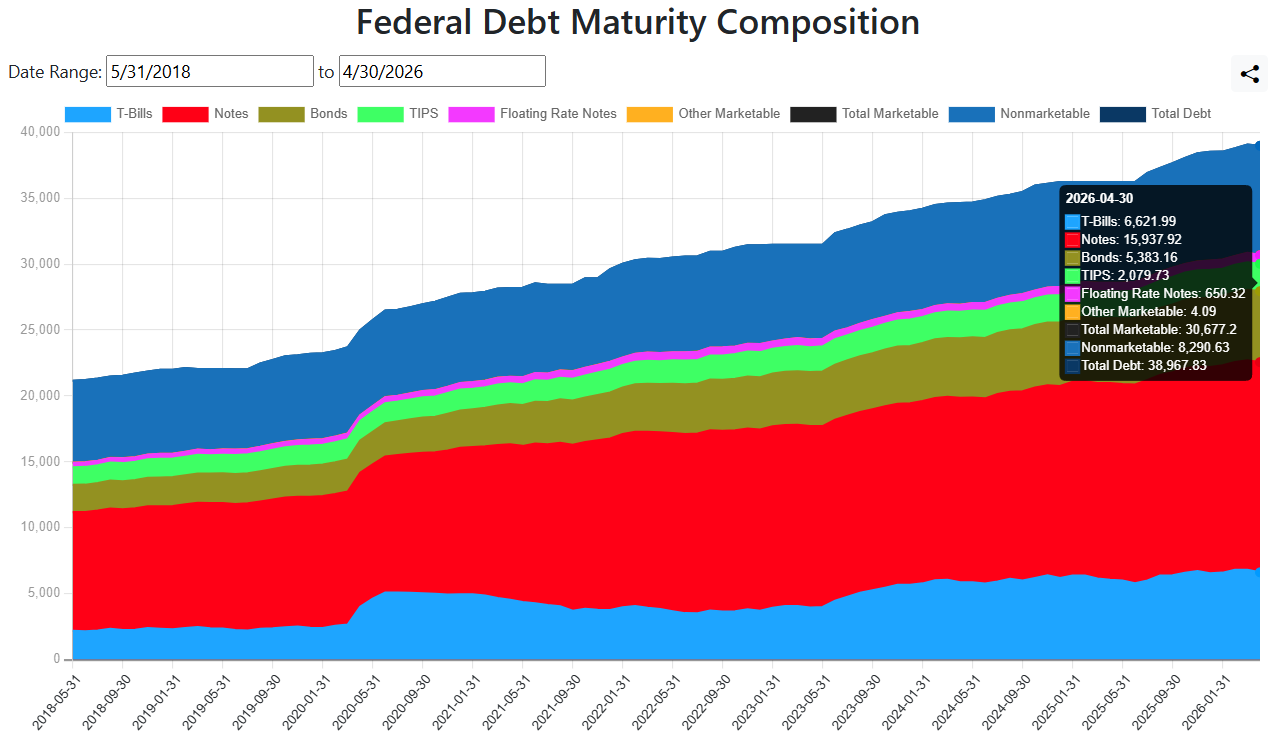
The debt aggregation charts on this website are based on information obtained from the FiscalData website managed by the US Treasury Department. There you can download the source data sets and the full PDF publication of the MSPD.

The MSPD also contains much more granular data, which can be used to make even more detailed breakdown charts. If this is of interest to you, please come on our Patreon and provide your feedback and feature requests!

  1. TreasuryDirect.gov - Treasury Bills
  2. TreasuryDirect.gov - Treasury Notes
  3. TreasuryDirect.gov - Treasury Bonds
  4. TreasuryDirect.gov - Floating Rate Notes (FRNs)
  5. Series EE and Series I US savings bonds held by individuals
  6. State and Local Government Series Securities
  7. https://www.federalreserve.gov/econresdata/notes/feds-notes/2015/federal-debt-in-the-financial-accounts-of-the-united-states-20151008.html

Personal Consumption Expenditures (PCE) Price Index now available on the Time Series Chart!


We just added the Personal Consumption Expenditures (PCE) Price Index to the Time Series Chart and Revisions page. PCE is a measure of inflation, similar to CPI, often referred to in media as the Fed's preferred measure of inflation. Like CPI, the PCE price index tracks the prices in a basket of goods over time. However, PCE is a chain-linked index, meaning that items in the basket can be substituted, unlike traditional CPI which keeps the same basket of goods and only adjusts the weighting of the categories. PCE has monthly adjustments to the basket whereas the CPI basket is only re-weighted annually. PCE is also frequently revised retroactively, whereas CPI is not. Because of these features, the Fed believes that the PCE Price Index provides a more comprehensive view of inflation than the traditional CPI.

The time series chart with the PCE inflation metric added


There are some areas where CPI's lack of backwards revision is desirable. For example, CPI is used for calculating pricing adjustments to Treasury Inflation-Protected Securities (TIPS). For social security's cost of living adjustment (COLA), CPI-W is used.

On this website, you can now compare CPI and the PCE index side by side on the same chart. We also have the Producer Price Index (PPI), which is thought to be a leading inflationary indicator. 

Here is an overview of the differences between the baskets:

+--------------------------------+------------------------+------------------------+---------------------+
|                                | CPI                    | PCE                    | PPI                 |  
+--------------------------------+------------------------+------------------------+---------------------+
| Issuing Authority              | Bureau of Labor and    | Bureau of Economic     | Bureau of Labor and |
|                                | Statistics (BLS)       | Analysis (BEA)         | Statistics (BEA)    |
+--------------------------------+------------------------+------------------------+---------------------+
| Purpose                        | Household/consumer     | Household/consumer     | Producer inputs     |
|                                | goods                  | goods                  | (leading indicator) |
+--------------------------------+------------------------+------------------------+---------------------+
| Chained?                       | No                     | Yes                    | Yes                 |
+--------------------------------+------------------------+------------------------+---------------------+
| Rebalance Frequency            | Annual                 | Monthly                | Annually            |
+--------------------------------+------------------------+------------------------+---------------------+
| Retroactive revisions?         | No*                    | Yes                    | Yes                 |
+--------------------------------+------------------------+------------------------+---------------------+

* CPI provides Seasonally Adjusted (SA) and Not-Seasonally Adjusted (NA) figures. The Seasonally Adjusted figures can be retroactively revised upto 5 years back, Not-Seasonally Adjusted figures are not typically revised unless there is a significant change in calculation such as the base year. The SA data set is intended for month-to-month measures of inflation, the NA data set is intended for year-over-year comparisons.      
Related references:


  • https://www.youtube.com/watch?v=oRdLvp6H3CU
  • https://www.clevelandfed.org/center-for-inflation-research/consumer-price-data
  • https://www.clevelandfed.org/publications/economic-trends/2014/et-20140417-pce-and-cpi-inflation-difference
  • https://www.morningstar.com/markets/whats-difference-between-cpi-pce

GDP Data Release Revisions

Earlier this year we greatly expanded the functionality of the US Treasuries & Economic Indicators Time Series page, allowing users to compare interest rates against other economic data such as GDP and inflation metrics. It is important to note that such economic data released by the US government is frequently revised. This means that the historical data you are looking at today could be very different from how it was originally reported. On the Time Series page, we provide you the option to view the values as their current official datasets or as the values were reported when the data releases were first made public.

Updated time series chart showing the newly added GDP and inflation metrics

Some metrics get revised more radically than others. GDP is notorious for undergoing numerous revisions that could result in drastic differences from the initial report over time. This is why recessions are often only realized by the government reporting agencies well after the fact. For example, in the figure above, real GDP growth for the Fourth Quarter of 2021 was 6.9% in the "Advance" estimate of the Bureau of Economic Analysis, reported January 27, 2022. On September 26, 2024, a "comprehensive revision" by the BEA changed this value to 7.9%.

Comprehensive revisions occur regularly, in which case the BEA may make changes to the last 5 years of reported GDP figures. Comprehensive revisions can even overwrite what that BEA calls "Final" GDP estimates. The Q4:2021 "Final" estimate, provided in a press release dated March 30, 2022, stated the real GDP growth to be 6.9%.

On our new page titled Economic Data Revision History provides a table of economic data revisions, allowing you to see the number of changes to a given data set over time. At the time of its release, you can view the history of revisions to CPI, PPI, real GDP growth, and the unemployment rate. More datasets will be available soon!

The table showing the revisions to economic indicators published by the US government


Why many GDP revisions are labeled on 6/17/2024

When viewing the GDP economic revisions, a large amount of the data has a "Revision Date" of 6/17/2024. That is the date which this website began aggregating the real GDP growth metrics from BEA data. We felt it appropriate to label those data points with that particular date because we know that's what the figures were reported by the BEA as of that date. We do not have information as to the originally reported values of those data points and their revision history. All we can verify is how the BEA reported them on 6/17/2024.

Most of the other GDP revision dates and originally reported values have been obtained from the BEA press release archive. Unfortunately, this archive only has press releases going back to 1994. We do not have a history of revisions for GDP growth prior to that.

CPI y/y revisions

The "seasonally adjusted" CPI, which is used for month-to-month comparisons, is subject to revision for up to 5 years. The "not seasonally adjusted" CPI figures are revised infrequently, and usually only occur when the Bureau of Labor and Statistics changes calculation methodology. Some significant revisions are noted around these years:
  • 1919: The BLS began publishing separate consumer price indexes for 32 cities. This was the initial attempt to systematically measure changes in consumer prices across different urban areas.
  • 1940: The first major revision of the CPI was implemented, which included a shift to a more comprehensive sample of goods and services and updated weights based on the 1934-36 Consumer Expenditure Survey.
  • 1953: Another significant revision introduced a new base period (1947-49) and expanded the geographic coverage of the index.
  • 1964: The CPI was revised to use the 1960-61 Consumer Expenditure Survey for weights, and the base period was updated to 1957-59.
  • 1978: This revision introduced a new base period (1972-74) and incorporated changes in the sampling and pricing methods. It also marked the beginning of the CPI for All Urban Consumers (CPI-U) and the CPI for Urban Wage Earners and Clerical Workers (CPI-W).
  • 1988: The base period was updated to 1982-84, and the methodology was further refined to improve accuracy.
  • 2000:  Starting in 1998, BLS began using a geometric mean formula for most basic indexes that mitigates lower level substitution bias and reflects shifts in consumer spending with item categories as relative price change 
References: